Simplifying cervical screening reporting with SERT in Power BI and Palantir
#AI#Data Design#UX#Product Design#Healthcare

An enquiry tool that gives screening teams fast, intuitive access to millions of rows of data — surfacing insights while revealing platform constraints early.
Highlights
- Prototypes built in Power BI and Palantir FDP
- Simplified querying of millions of screening records
- Export & filter features aligned with real-world workflows
- Surfaced technical constraints early to steer build
100M+ rows of data made explorable
Uncovered platform limits early
Delivered dual-platform prototypes
The Challenge
Cervical screening generates vast amounts of structured data, but accessing it was slow and inconsistent across teams.
Data scale
Millions of participant, results, and notification records needed to be queried quickly
Filtering
Users expected Excel-like interactions, but tools had limitations
Audience
Mix of analysts, programme managers, and local teams with different needs
Constraints
Had to test across both Power BI and Palantir FDP to uncover platform strengths & weaknesses
Design Approach
Breaking down the key design decisions that shaped a clear, scalable reporting experience.
Rapid prototyping and user research
There were 3 rounds of user research, with each stage validating an existing user need or discovering a new one. Being able to rapid-prototype directly within Power BI, meant that pain points could be solved almost as quickly as they were being discovered. This journey evolved a proof of concept originally created by developers for developers, to a prototype that had been thoroughly tested, validated and designed for the end user.
Key insight: Rapid prototyping and staying agile, carved a path to success months ahead of schedule.
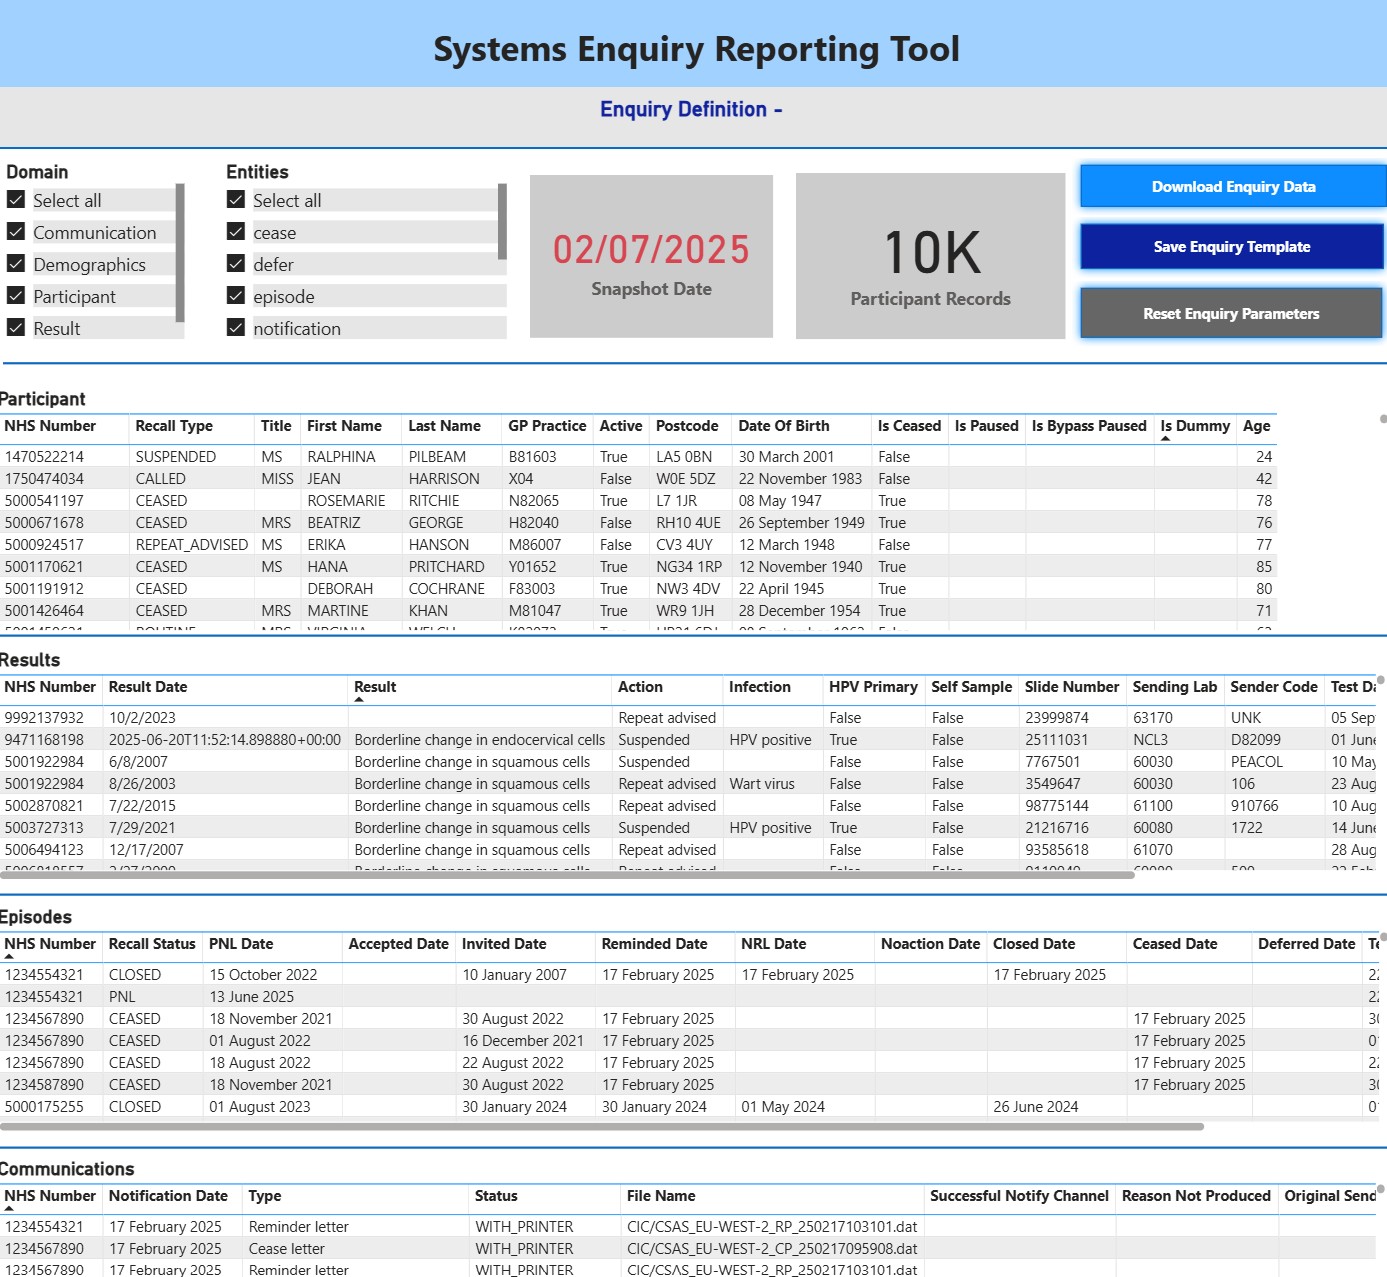
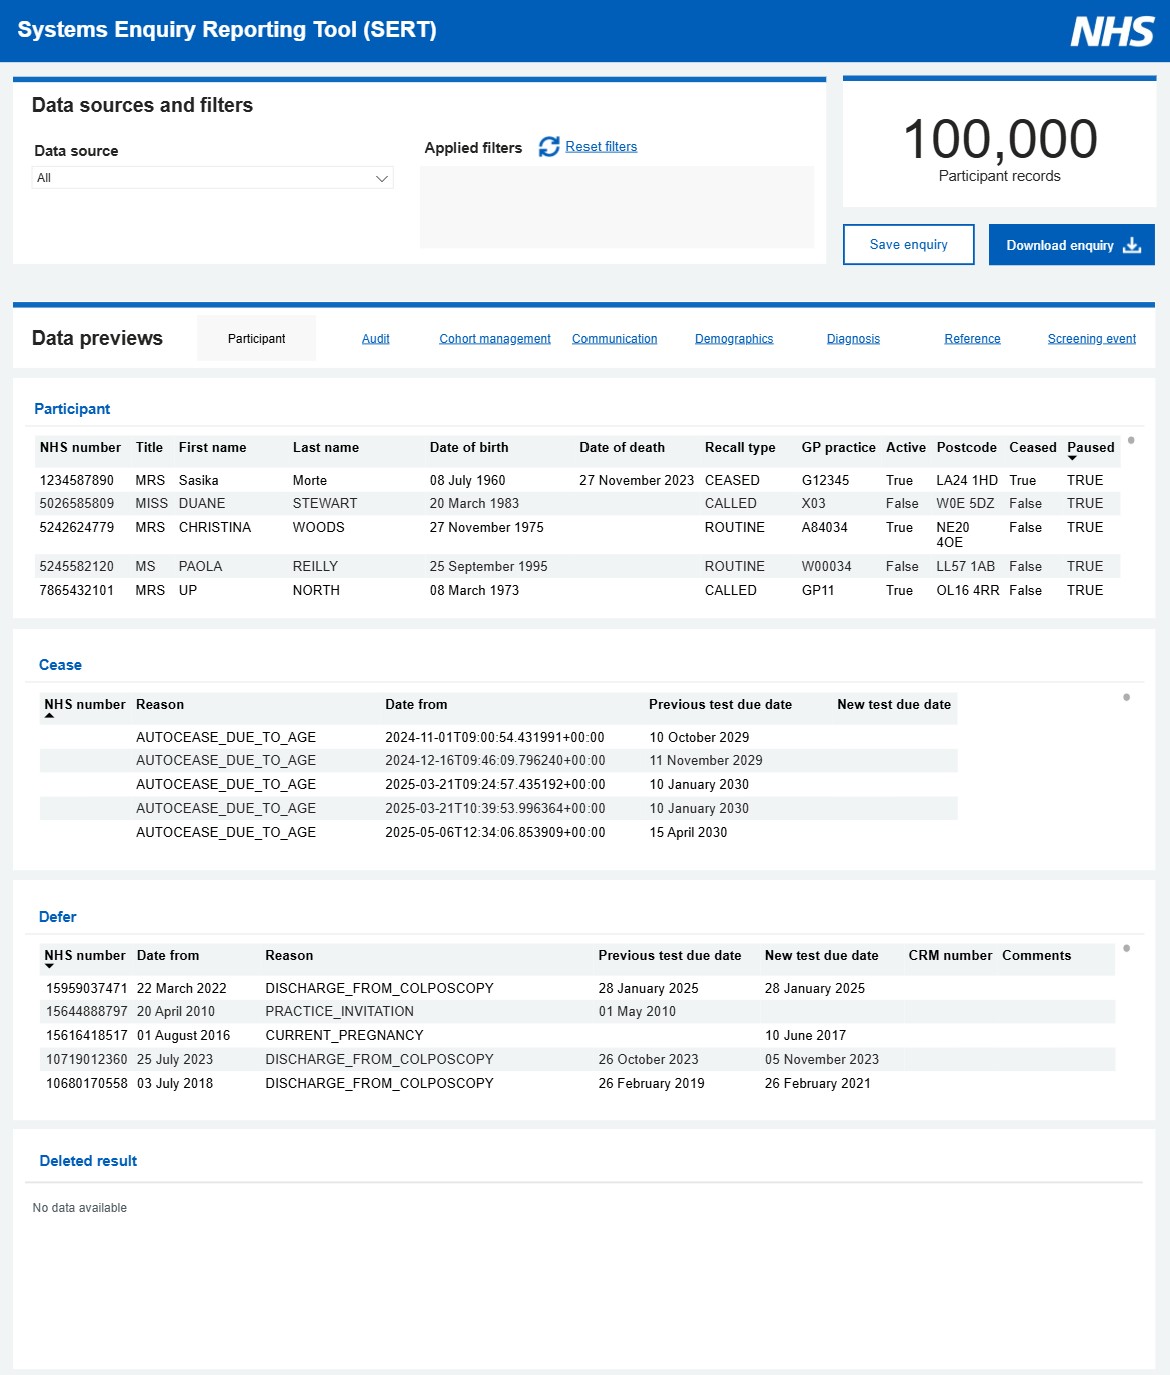
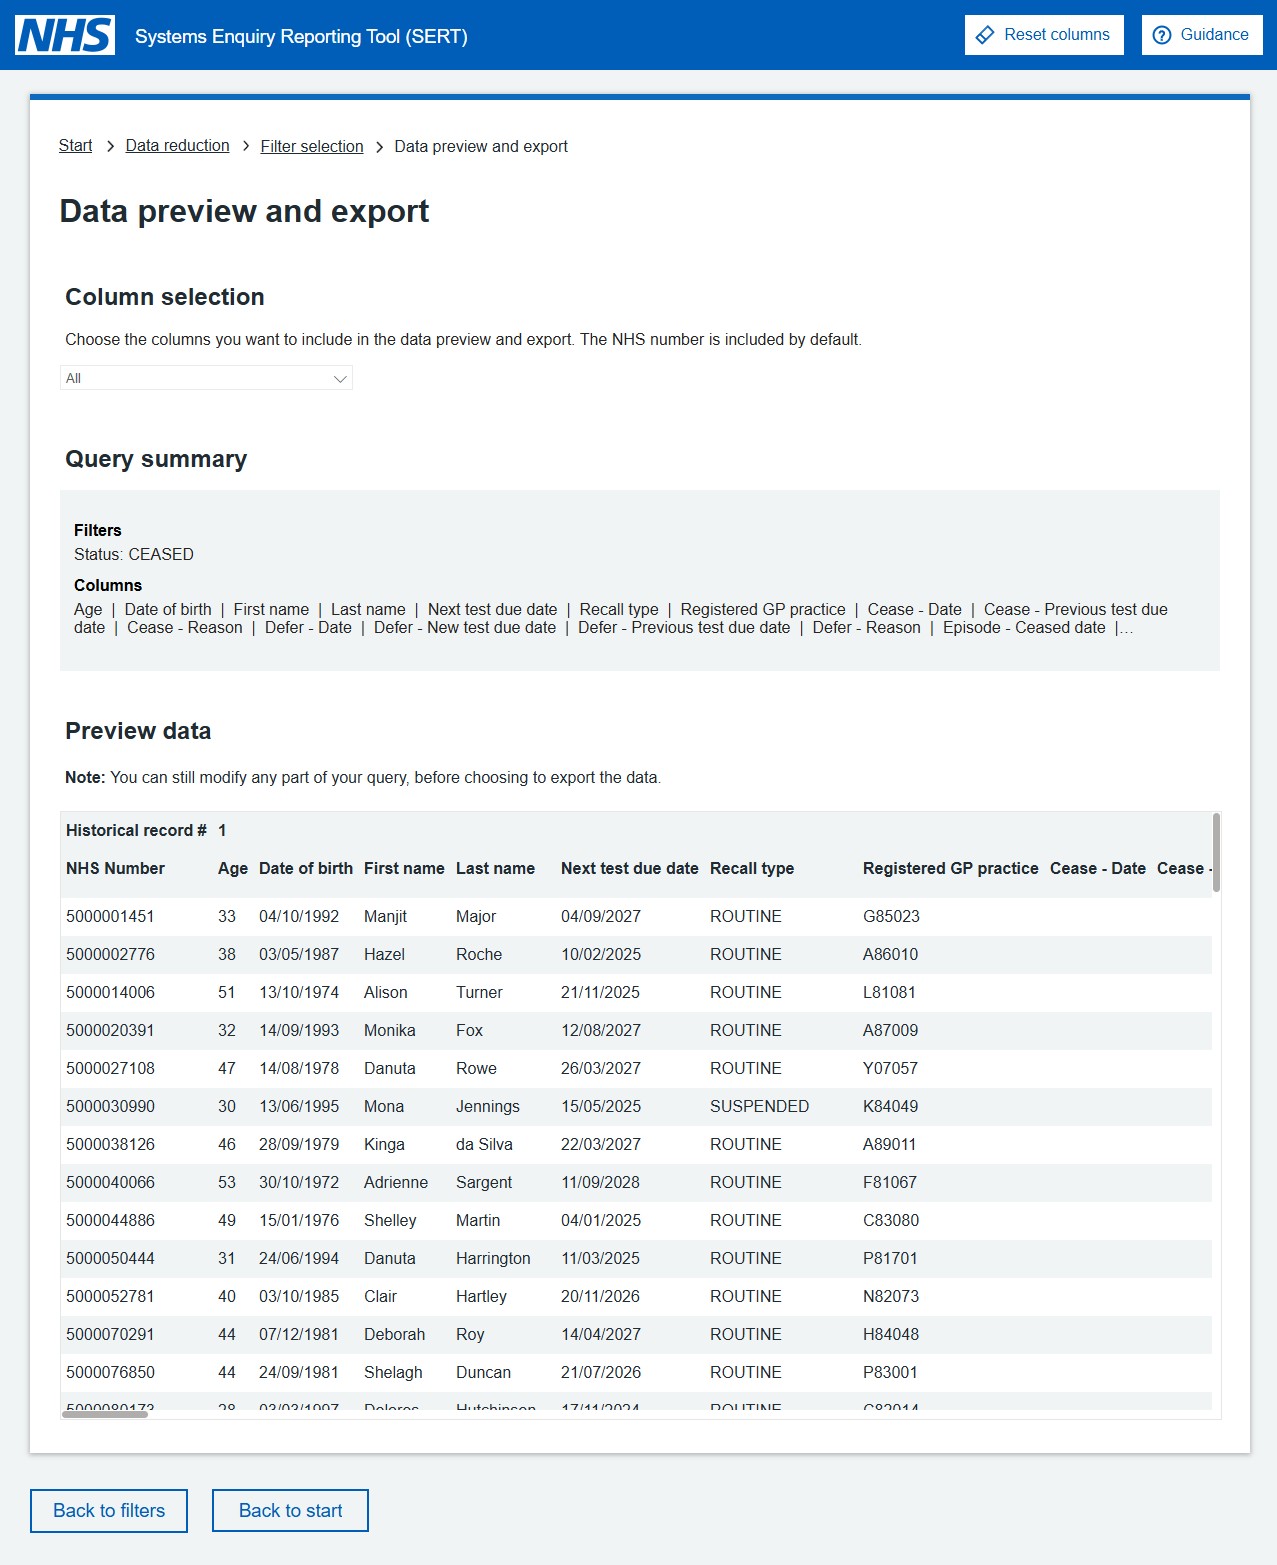
Designing intuitive filters
Users needed a way to query millions of rows without technical expertise. The original proof of concept relied heavily on utilising out of the box filtering capabilities, but for inexperienced users, these proved too difficult to use. Therefore, I created a filtering interface that mirrored familiar website patterns, making it simple for teams to build queries quickly and confidently.
Key insight: Familiar controls reduced training needs and boosted early adoption.

Navigating across multiple tables
Complex queries often required combining participant, result, and notification data. I designed flows that made cross-table joins feel seamless, so users could explore relationships without the complexity of writing SQL.
Key insight: Prototypes exposed Power BI’s limitations with joins, guiding the team toward Palantir FDP as the more scalable platform.

Supporting exports and local analysis
Even with richer dashboards, teams still needed data in Excel for deeper analysis. I introduced streamlined export options that balanced short-term user needs with long-term platform sustainability.

Testing performance at scale
Prototypes were pushed to their limits, doubling as stress tests for how each platform handled real-world data volumes. This gave stakeholders evidence to make informed technical decisions.
Key insight: Prototypes became decision-making artefacts, not just design deliverables.

Outcomes
The prototypes delivered tangible improvements for users and stakeholders, turning design work into a tool for decision-making as well as usability.
Aligned with user workflows
Prototypes matched the familiar “set parameters, run query, export” mental model, building confidence and trust.
Uncovered platform limits early
Testing with millions of UAT rows revealed performance issues before major development time was committed.
Delivered dual-platform prototypes
What changed
-
Teams could filter, query, and explore data far faster than before.
-
Stakeholders gained clarity on platform trade-offs between Power BI and Palantir FDP.
-
Early testing prevented costly missteps in development.
- Prototypes provided immediate user value while de-risking long-term technical investment.
Reflections
The project highlighted how design can act as a bridge between users and technical platforms, shaping not just interfaces but strategic decisions.
Key learnings
-
Even simple prototypes can uncover hidden platform constraints.
-
Balancing familiar patterns (like Excel-style filtering) with scalable design is essential for adoption.
-
Design artefacts can guide not only usability but also long-term strategic decisions.
Current status
Previous case study
NHS – Transforming breast screening data